Moving Average Bounce Trading Strategy
This is the best moving average trading strategy because bounces are reliable trading signals in the prevailing direction of the trend. With it, you’ll buy and sell stocks with the lowest risk and highest reward potential.
Moving averages (MA) are the most popular indicator for trading trends. Investors who employ technical analysis find moving averages useful and observe the price in relation to make investment decisions.
Stocks are considered bullish if the price is above the moving average and bearish if it is below.
A simple moving average trading strategy is to buy as long as the price remains above it and sell for as long as the price remains below it. I used this strategy in a real-world scenario before where I turned oversold Chinese stocks into $110,340.
You’ll often hear about the simple moving average, or SMA, but the more reliable moving average is actually the exponential moving average, or EMA. I’ve written more about what the exponential moving average is in a separate post. It’s a weighted moving average that reacts faster to recent price changes.
The mother of all EMAs is the 200-period EMA, or simply 200 EMA, and is used as a signal for long-term trends. When the market is in a strong and sustained uptrend, the EMA will also show an uptrend and vice-versa for a downtrend. Use the 200 EMA in the daily, weekly and monthly time frames as a start.
Make no mistake: Amateur traders will often encounter the moving average crossover strategy discussed in internet forums. It’s been proven that this strategy doesn’t work. I’m therefore proposing a much better alternative, the moving average bounce trading strategy.
What Is the Moving Average Bounce Trading Strategy
Moving averages act as support or resistance when the price approaches it. This allows you to observe how the stock price behaves as it approaches and bumps against the EMA. The price can be rejected or ‘bounced’ off at the 200 EMA which is considered a sign of continuation of the long-term trend.
Such EMA bounces are entry opportunities where the risk is the lowest and the reward potential is the highest.
Below chart shows an example of how the QQQ (Nasdaq-100 ETF) bounced off its weekly 200 EMA in March 2020:
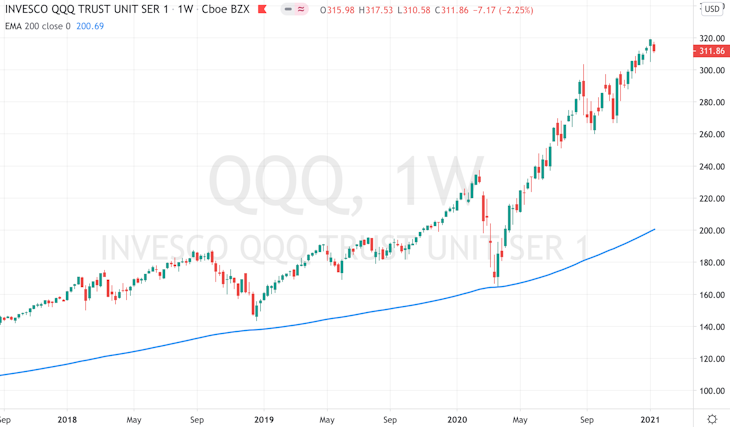
When you look at charts, you want to have instant orientation and be able to make profitable trades. I can’t do that if my charts are cluttered with indicators – one contradicting the other. My only indicator is the 200 EMA which I watch in conjunction with the current price level.
A trading signal can be triggered when the price retreats to its 200 EMA and reacts with a decisive bounce.
If you watch price action in real-time, you can see how the price slightly penetrates the EMA, only to get forcefully swung back in the opposite direction like a flipper bouncing the ball in a pinball machine.
If valuations and future prospects are favorable at these price levels, investors will be unwilling to sell further and new investors will want to buy in. Bearish investors will start to cover their short positions. These dynamics create sustainable upward pressure which results in the price bouncing off its 200 EMA.
The reason why this EMA trading strategy works so well with the 200 EMA is because market participants are floating in a sphere of tremendous lack of certainty. No one knows where perfect valuations are. Even if you came up with a perfect valuation, you wouldn’t know if other market participants agree with you. It’s hard to focus if prices wiggle around erratically. Moving averages give prices orderly and predictable boundaries.
How to Trade the Moving Average Bounce Strategy
Long-term oriented investors should watch the 200 EMA particularly in the weekly and monthly time frames. Trends in the weekly and monthly time frames are less sensitive to short-term volatility than in the daily time frame.
When the EMA is trending upwards, you should consider buying when the price bounces off the EMA. The reverse applies when the EMA is trending downwards, in which case you should be selling short when price rallies towards the EMA and gets rejected there.
Let’s review above chart and see how the immensely obvious buy signal in March 2020 was taken advantage of:
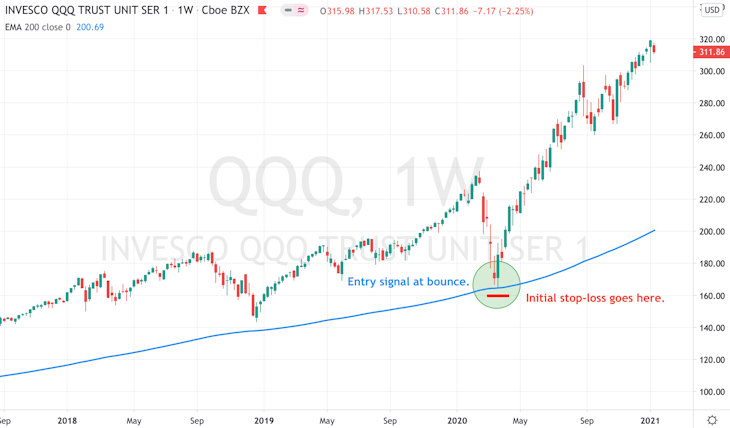
As you can see, prices retreated to the 200 EMA in the weekly time frame. Before they could fall much further, bulls entered the scene to stage a strong bounce off the 200 EMA. These are one of my most favorable entry signals in trend following.
How I Discovered the Use of Moving Averages
I started trading index futures in 2007 and joined IRCs where I chatted with other active traders daily. One day, someone pointed out that the S&P 500 was touching a particular moving average and that this event was particularly noteworthy because it had consistently reacted to the line.
So I asked him: “Do you mean that I just have to find a moving average that the price reacts to?”
“Yes.”
That lid up a light bulb! You don’t look at the price and the moving average separately, but in conjunction. You focus on the reaction. Immediately, I dug through historical charts to verify if prices reacted to the moving average consistently. They did indeed.
Using the Moving Average In Multiple Time Frames
Suppose a bounce appears to be underway. What you do now is you switch to the 1-hour time frame to find a precise entry. You may even find more suitable peaks or troughs in this intraday time frame.
Price action there must confirm the bounce in the bigger picture. Watch for a visual break of resistance, for example. The aim is to buy into the bounce and protect your capital with an initial stop-loss order slightly underneath the low created. Near 164.00 in our example.
Here is how you would trade a bounce in the 1-hour time frame:

If your charting platform supports multiple time frames in the layout, I would monitor a time frame where a bounce is currently underway (the weekly time frame in our example) and the 1-hour time frame simultaneously for a precise entry.
Watch me trade for a while and you will notice that I often enter way before a break occurs. I don’t advise that to beginning traders but as soon as you accumulate screen time, you’ll start to get a hang for momentum. It significantly improves the entry and reduces the distance to your initial stop – but do that with caution.
Using Moving Averages Limits Your Risk
In trend following, your risk must be actively limited while your reward is should be open-ended (theoretically, that is). Because many market participants are observing the 200 EMA, it makes trading trends a self-fulfilling prophecy.
I want to emphasize that it’s important to wait for that bounce reaction. If the price crosses its 200 EMA like a ‘hot knife through butter’, it’s a strong indication that the trend is reversing.
Blindly buying or selling at the 200 EMA is reckless.
The 200 EMA offers a benchmark at which investors can reassess valuations and ‘vote’ on the path forward. The valuations can remain unreasonable at the 200 EMA upon which the price will simply disregard it.
Matt Hagemann
January 21, 2021