Why the Golden Cross and Death Cross Do Not Work
A golden cross or death cross is an event when a short-term moving average crosses a long-term moving average from below (bullish crossover) or from above (bearish crossover). Traders use these crossovers as confirmation of the dominant trend.
How to Use the Golden Cross or Death Cross
The golden cross or death cross trading strategy is used to confirm the direction of a long-term trend.
For example, the most popular scenario is when the 50-day moving average and the 200-day moving average cross in order to catch a trend reversal.
These crossovers carry an inherent delay which means that they happen long after a new trend is already underway. Instead of giving you foresight, these moving average crosses seem to be a signal for the hindsight.
I’ll show you the trading performance below and offer an alternative to the crossover strategy, so keep reading.
Is the Golden Cross Pattern Reliable
I tested whether these events have been reliable using historical price action in the S&P 500. In below chart, you can identify several marked occurrences in the daily time frame where a golden cross pattern (including death cross pattern) occurred in the S&P 500.
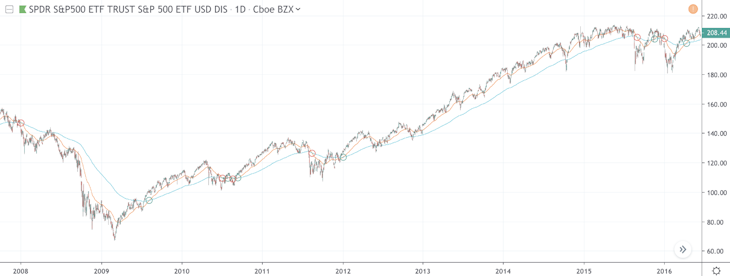
You can see that — with the exception of one death cross in 2008 — all death crosses eventually resulted in a loss because the market promptly rebounded and never sustained a downtrend.
This is actually in line with my own trading experience. These signals have a significant time lag and are therefore unreliable.
You would have been better off, trading only golden crosses because the S&P 500 tends to go up in the long-term. You are also exposing yourself to whipsaws which happen periodically during phases of uncertainty. Whipsaws happened in the years 2010, 2012, and again in 2015 when you had multiple crossovers.
Let’s take a closer look at the crossovers as if you had traded them in a realistic scenario. I’m documenting three different backtest results and how a $10,000 investment has evolved in each. The trading rules were:
- Golden cross trading strategy: Buy at the first closing price when the 50 EMA crosses above the 200 EMA and close at the first death cross signal.
- Death cross trading strategy: Sell short at the first closing price when the 50 EMA crosses below the 200 EMA and cover at the first golden cross signal.
Long-Only Golden Cross Trading Strategy
Result if you only take golden crossovers:
| Open | Open Date | Close | Close Date | Return | |
|---|---|---|---|---|---|
| 99.73 | 2009-08-11 | 107.96 | 2010-07-09 | 8.25% | $10,825.23 |
| 112.76 | 2010-08-02 | 105.53 | 2010-08-24 | -6.41% | $10,131.13 |
| 113.05 | 2010-09-16 | 119.67 | 2011-08-17 | 5.86% | $10,724.39 |
| 128.04 | 2012-01-05 | 191.77 | 2015-09-01 | 49.77% | $16,062.30 |
| 205.62 | 2015-11-16 | 191.92 | 2016-01-08 | -6.66% | $14,992.10 |
Short-Only Death Cross Trading Strategy
Result if you only take death crossovers:
| Open | Open Date | Close | Close Date | Return | |
|---|---|---|---|---|---|
| 138.91 | 2008-01-08 | 99.73 | 2009-08-11 | 28.21% | $12,820.53 |
| 107.96 | 2010-07-09 | 112.76 | 2010-08-02 | -4.45% | $12,250.52 |
| 105.53 | 2010-08-24 | 113.05 | 2010-09-16 | -7.13% | $11,377.55 |
| 119.67 | 2011-08-17 | 128.04 | 2012-01-05 | -6.99% | $10,581.78 |
| 191.77 | 2015-09-01 | 205.62 | 2015-11-16 | -7.22% | $9,817.55 |
| 191.92 | 2016-01-08 | 208.00 | 2016-04-13 | -8.38% | $8,994.98 |
Long-Short Trading Strategy
Result if you take every crossover signal and risk whipsaws:
| Open | Open Date | Close | Close Date | Return | |
|---|---|---|---|---|---|
| 138.91 | 2008-01-08 | 99.73 | 2009-08-11 | 28.21% | $12,820.53 |
| 99.73 | 2009-08-11 | 107.96 | 2010-07-09 | 8.25% | $13,878.52 |
| 107.96 | 2010-07-09 | 112.76 | 2010-08-02 | -4.45% | $13,261.47 |
| 112.76 | 2010-08-02 | 105.53 | 2010-08-24 | -6.41% | $12,411.16 |
| 105.53 | 2010-08-24 | 113.05 | 2010-09-16 | -7.13% | $11,526.75 |
| 113.05 | 2010-09-16 | 119.67 | 2011-08-17 | 5.86% | $12,201.73 |
| 119.67 | 2011-08-17 | 128.04 | 2012-01-05 | -6.99% | $11,348.32 |
| 128.04 | 2012-01-05 | 191.77 | 2015-09-01 | 49.77% | $16,996.77 |
| 191.77 | 2015-09-01 | 205.62 | 2015-11-16 | -7.22% | $15,769.23 |
| 205.62 | 2015-11-16 | 191.92 | 2016-01-08 | -6.66% | $14,718.56 |
| 191.92 | 2016-01-08 | 208.00 | 2016-04-13 | -8.38% | $13,485.37 |
The long-only trading strategy had the best performance. But wait until you see how a simple buy-and-hold strategy would have performed with much less stress.
Let’s assume you had bought at the first golden cross on August 11, 2009. As of April 13,2016 (the last action taken in any of the above tables), your initial $10,000 investment would have turned into $20,856.31 (a 108.56% return excluding dividends).
Neither the golden cross nor the death cross signals are reliable in catching a trend. Trading with them does not seem like a profitable strategy in comparison with a less active buy-and-hold strategy.
I backtested with over 8 years of historical data in the example above and would argue that the trading performance is representative because the S&P 500 generally moves up with infrequent crashes in between.
I even gave a generous benefit of the doubt to the short-only trading strategy by including the enormous sell-off during the Great Recession. But after initial success, the stock market gradually erased those handsome profits.
Alternative to the Golden Cross Trading Strategy
There’s a more profitable trading strategy using moving averages. The moving average bounce trading strategy offers far better risk to reward ratios with every trade. It lets you trade market reversals at unusually low risks.
I’m consistently able to buy at market bottoms with the moving average bounce trading strategy and ride trends all the way up.
You should check out how I made $110,340 in the Chinese Stock Market as an example for how this trading strategy works. When share prices eventually bounce, you have a serious competitive edge against other traders.
Matt Hagemann
May 6, 2020