What is the Exponential Moving Average
If you want to trade stock market trends, you have to learn about the significance of moving averages. Here is everything you need to know about the Exponential Moving Average and why it’s the most reliable indicator for trading trends.
Moving averages smooth the price data to form a trend trading indicator. They measure trend direction over a period of time by calculating the average of preceding price data. It results in a smooth line that tracks stock prices and that filters out the ‘noise’ of day-to-day volatility.
The two most popular types of moving averages are the Simple Moving Average (SMA) and the Exponential Moving Average (EMA). A charting software will let you add either one onto the stock chart to help you with your investment decisions. They can be used to identify the direction of the trend or define potential support and resistance levels.
Comparison with the Simple Moving Average (SMA)
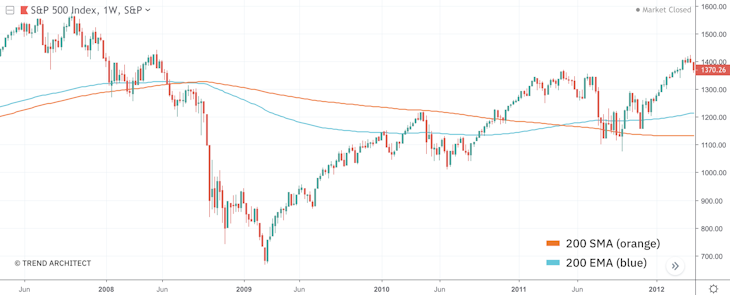
What is the difference between the SMA and the EMA, and which is better? The SMA was among the first technical indicators. It simply takes the arithmetic average of the preceding prices and plots it with every new period. Each price in the time period is given equal weight and prices outside of the time period are not taken into consideration.
For example, a 200-period SMA, or simply 200 SMA, is a line showing the average price of the preceding 200 prices. When a new pricing period starts, the oldest price drops out of the average and the price of the last period is used to plot the average at the new price.
The disadvantage of the SMA is that it’s much slower to react to recent price changes and is therefore less reliable. This is the advantage of the EMA. The EMA is a weighted moving average that gives more importance to recent prices. This causes the EMA to react faster to recent price changes and it became especially popular because it lags less than other averages. It will follow prices more closely.
If you need the exact formula to calculate the exponential moving average, you can find it referenced in a separate post.
| EMA | SMA | |
|---|---|---|
| Calculation | Weighted | Arithmetic |
| Price Sensivity | Faster reaction | Slower reaction |
| Historical Data | All prices | Only prices within period |
Why the 200 Exponential Moving Average
The length of the moving average depends on the analytical objectives, such as the investment horizon. Common moving average lengths are 10, 20, 50, 100 and 200. Some moving average lengths are more popular than others.
The 20 EMA may benefit the technical analysis of a shorter-term investor since it follows the price more closely than a longer-term moving average. A 200 EMA may be more beneficial to a longer-term investor.
The 200 EMA is perhaps the most popular because it is the most suitable for long-term oriented investments. It is also called the ‘mother’ of all exponential moving averages. It can be plotted in the weekly and monthly time frames onto your stock chart to monitor long-term trends.
Due to its long-term orientation, the 200 EMA carries enormous weight and any penetration of price is considered a significant moment observed by a majority of investors.
You can also use exponential moving averages as variable support or resistance levels for the current stock market price. When the price retreats within an uptrend, you may consider buying when the price dips near the EMA. When the price rallies within a downtrend, you may consider selling when price rallies towards the EMA.
There is some part of self-fulfilling prophecy involved as bullish investors want the price to stay above the 200 EMA, while bearish investors want the price to drop and stay below it. If the price penetrates through the EMA in a sustainable way, investors would resolve in switching camps and thus reinforce the price move even further.
Matt Hagemann
June 27, 2020