How I Made $110,340 From Oversold Chinese Stocks
I bought the bottom of the Chinese stock market and made $110,340 by literally sitting on my hands. Big trends can be identified in advance with a few indicators and I show you which ones with a real-life example.
In 2013, I felt that the time was ripe to invest in the Chinese stock market. I had been eyeing the Shanghai Composite for years. The 2007 bubble had burst and left share prices in shambles.
In contrast to the U.S. stock market, the Chinese one never recovered in the 6 years since. You may be scratching your head now: Wait a minute. Isn’t China on its way to becoming the world’s superpower? Why wasn’t their market performing?
I dug out the average P/E (price-to-earnings ratio) which was just 10. That’s quite cheap. For comparison, the S&P 500’s P/E hovered around 18 at that time. The Chinese stock market was either severely oversold or a value trap, meaning that earnings were expected to decline further.
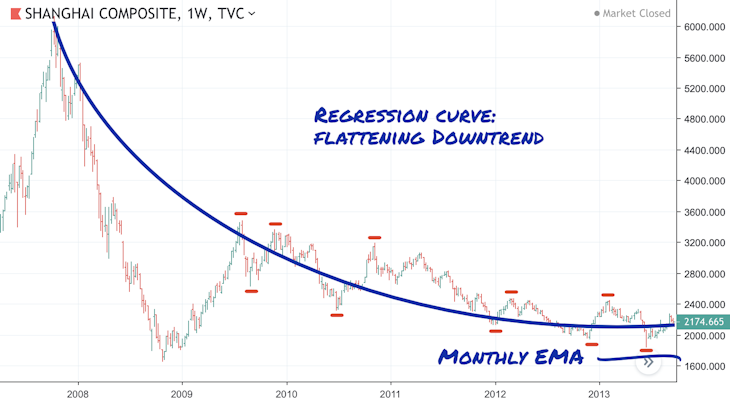
You can see in the chart below that the Shanghai Composite made a series of lower highs and lower lows, a Dow Theory downtrend pattern which I explained in my previous post on how to read price action. You also see that the rate of descent was flattening. It meant that market participants were starting to agree on a price level.
I call these price action patterns parabolic curves, borrowed from the parabola in mathematics. There are 4 types of parabolic curves and price action is simply a spiraling around one of these parabolic curves.
The Shanghai Composite was visibly in a flattening downtrend since 2008. It gave little further downside (unless unexpected risks emerged that were not yet priced in):
Since you can stack one parabolic curve after another in modular principle, the next curve had to be in the shape of one of the two types of uptrends.
I figured that after 6 years into its bear market, the likelihood of materially negative news was low. News at that time were about the worries in the Chinese housing market, but all of it was known and likely priced in.
If you do what everyone else is doing, you shouldn’t be surprised to get the same results everyone else is getting.
Knowing Exactly When to Buy
Two things assured me that the trade could work out spectacularly:
- The parabolic curve was flattening (as seen above).
- The Shanghai Composite was touching its 200 monthly EMA where it has always bounced off from historically.
I noticed that stocks consistently bounce off this moving average. Here was a real-time opportunity where I could test my theories.
I didn’t want to buy individual Chinese companies, but the market as a whole. My idea was that its largest companies will benefit meaningfully in a recovery. I had to look for an exchange-traded fund (ETF) that exactly mirrors the Shanghai Composite.
In Search for a Real Chinese ETF
Several funds have a China ETF traded on U.S. exchanges, however, none of them was an exact replication of a Chinese stock market index at that time.
I did not want my money to be at the mercy of some fund’s arbitrary investment strategy. No, I needed it to move precisely like the underlying index. If I pulled up a chart of the Shanghai Composite and see it going up by 1%, my position must have also gone up by 1%. I wanted every sneeze and every yawn exactly mirrored!
During my research, there was nothing for the Shanghai Composite, but I stumbled across a new ETF that offered direct exposure to the CSI 300, a stock market index of the top 300 stocks traded in the Shanghai and Shenzhen stock exchanges: Xtrackers Harvest CSI 300 China A-Shares ETF with ticker symbol ASHR. Fair enough.
When ASHR was listed in November 2013, it was nothing short of revolutionary because it holds positions directly in Chinese A-shares. A-shares are those of local Chinese companies traded in Renminbi. They are accessible primarily to locals. Qualified Foreign Institutional Investors (QFII) who have been granted special permission by the Chinese government can also participate in this market. Xtrackers became one of the special permission holders.
Sure enough, every move in the underlying index was closely represented in the ETF.

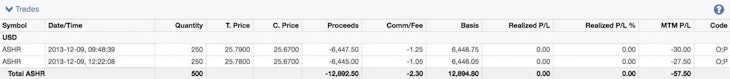
I purchased my first 500 shares on December 9, 2013 at $25.79 for a total of $12,894.80 (including commission):
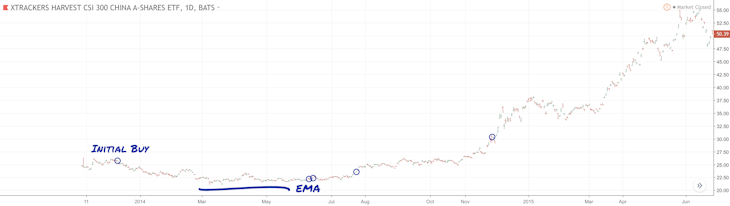
The index did not move much for another half a year. In fact, I was down roughly 15% with the ETF most of the time.
Then it happened: The index was hitting the EMA and it stopped moving down further. It’s as if prices were hitting a concrete floor that no one else could see!
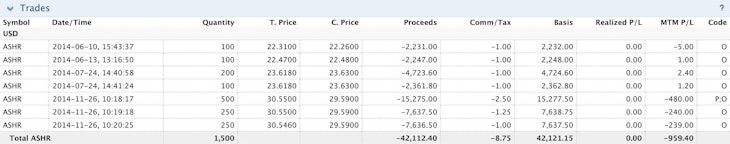
On June 10, 2014, I did another purchase of 100 shares at $22.31, then another 100 shares at $22.47, another 200 shares at $23.62. I continued to buy more and more throughout the year. Prices were hovering nicely above the EMA.
When the market did take off, I quickly bought another big chunk. By the time I was done buying, I had accumulated 2,000 shares at a value of $55,015.95 (including commission), enough to keep me comfortable. It was time to sit back and let the market do its work.
Sitting On Your Hands Makes All the Money
The uptrend gained steam toward the end of 2014. The stock market index didn’t just rise gradually, but literally skyrocketed for the next months.
I’ll share a big secret of the ultra-rich with you that is highly controversial to someone in the workforce: Never work hard for your money. Make your money work hard for you. Your savings may have been built up through hard work, but real fortunes are not made by working hard but made by doing nothing.
That’s right. You sit on your hands and watch your wealth accumulate because your money is working for you now. Let it do its work and do not dare to interrupt it.
In June 2015, the total value of my 2,000 ASHR shares stood at $110,340.00:

I did a few things wrong, but I also clearly did a few things right. Clueless day-trading “gurus” on social media help you to cope with losing. To me, this is a red flag. These communities resemble a self-help group. I help you to cope with winning!
With this coup, I had proven my strategy’s worth. Financial freedom is inevitable. All you have to do is apply my strategies to find new opportunities of similar magnitude.
What you have to know in order to understand trends is this: The biggest influence on the price of a stock is the price of a stock. Such feedback loops make trends happen, and that’s where you will make money riding the big trends.
Your Entry Price Decides Everything
Sun Tzu’s classic The Art of War isn’t necessarily recommended reading, but there is a particular quote that’s fitting:
“Every battle is won or lost before it’s ever fought.”
Sun Tzu
Sun Tzu was referring to the preparation, positioning, and planning that make the difference in the success of a battle. A well-planned trading strategy, mapped out to the smallest detail, is a guarantor of trading success.
Success or failure is predetermined before you enter a trade. Does it make sense to you? Your entry price determines whether you’ll be able to exit at a better price in the future.
That’s why my trading strategy focuses so much on trade entries. If you caught the entry correctly, all trends that ensue will be smooth-sailing. You will be making profits on autopilot.
People often told me that this trading strategy is unlike anything they’ve previously seen. This makes me quite proud.
Matt Hagemann
April 12, 2021