Trend Trading With Parabolic Curves
Use parabolic curves to trade in the direction of the trend. This is the most underrated forecasting technique to trade price action consistently for profit.
Marcus Tullius Cicero, a statesman and philosopher in ancient Rome, is famous for saying that the man who doesn’t know what happened before he was born goes through life like a child.
Before a new trend is born, it is already trotting on its underlying parabolic curve. Your task as trend follower is to identify them at their initial stage and hold your position while price action accelerates in the same direction.
If you don’t spot the curve, you will trade the market like a child — and earn like a child.
What Is a Parabolic Curve
A parabolic curve in trend following is a smooth curve fitted on a price chart. It is named after the parabola in mathematics because historical price action often takes the shape of a parabolic curve.
You draw it manually using your charting software. Following the principle of least volatility, we identify where the price regularly moves back to by intentionally blending out larger gyrations. In other words, you focus on the narrow corridors where the price doesn’t move much. These are price levels where most investors could find a consensus. Trace these narrow corridors and you will see how they shape up a smooth curve.
In statistics, this method of regression analysis is called ‘curve fitting’. It helps us establish a bias in order to follow trends in the direction of that curve. The trend is your friend, as you know.
Here’s an illustration of what was said above using Walmart’s stock:
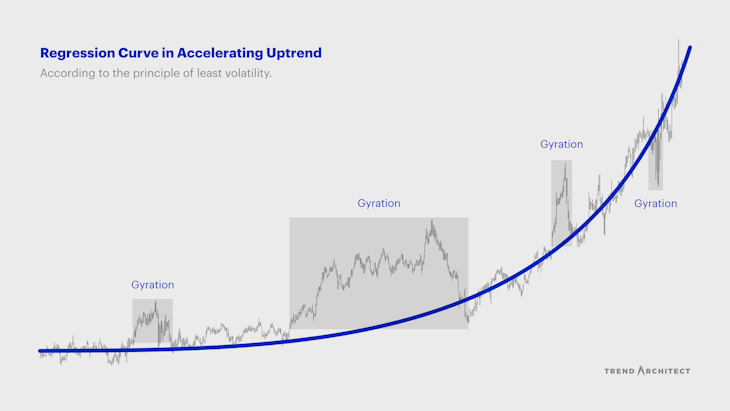
Every trend is confined to its parabolic curve and it’s our task as trend followers to identify, with the help of our naked eyes, which curve dominates.
I’m certain that there is a way to turn it into algorithm and the experimental technocrat is free to give a try. For the time being, we have to fall back to human intelligence.
The 4 Types of Parabolic Curves
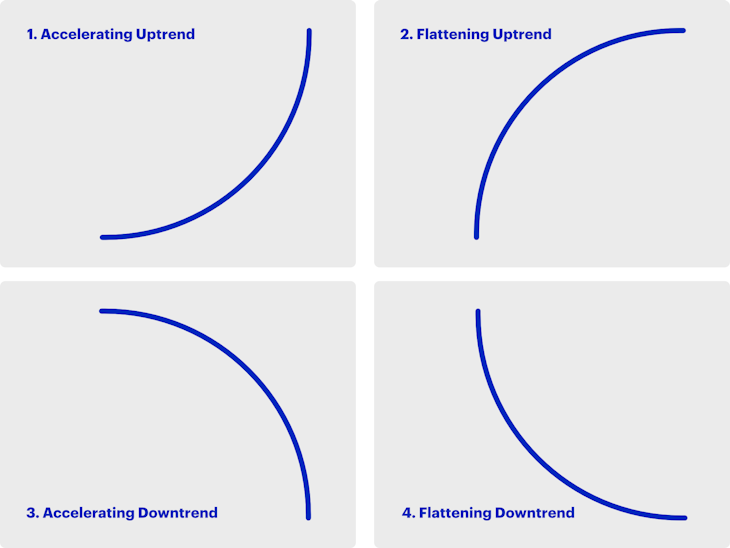
There are four types of parabolic curves along which all trends evolve and they always take the shape of a logarithmic line. It is vital to detect them early to make sense of price action and to predict its overall direction.
- Accelerating uptrend: Prices are narrowly range-bound with an upward tendency and gradually accelerate to escape velocity.
- Flattening uptrend: Prices bounce with strong upward momentum which gradually fades to a flattening range.
- Accelerating downtrend: Prices are narrowly range-bound with a downward tendency and gradually accelerate to a desperate collapse.
- Flattening downtrend: Prices collapse with strong downward momentum which gradually fades to a flattening range.
How to Analyze Trends in Modular Principle
You can stack one parabolic curve after another in modular principle to make sense of price action and to predict the overall direction.
A new trend may be shaping up once price action deviates too far from its ordinary price corridor along the current parabolic curve. The initial move is often enough to pick the most likely parabolic curve out of the four.
Trends can even follow two or more curves at the same time if you zoom in and out of time frames. There can be an accelerating uptrend (1) in the weekly chart while the shorter term, daily chart indicates a flattening uptrend (2) followed by a flattening downtrend (4). It could look like this:

You should figure out whether you prefer to trade the long-term or short-term trends. By trading the large trends, your interests will strongly align with investors who buy and hold for the long run. If you’re invested in the right company, that’s likely the best option.
I believe folks who’ve done the best with Wal-Mart stock are those who have studied the company, who have understood our strengths and our management approach, and who, like me, have just decided to invest with us for the long run.
Sam Walton, “Made in America”
What If Our Mappings Differ
Your own analysis could differ from mine and that’s perfectly legitimate. There is a fair degree of TLAR involved. You squint at the screen and draw the curve along a line ‘that looks about right’. This kind of analysis is naturally subject of debate which is why it is best solved either individually as a seasoned market participant or collectively with fellow trend followers.
You can see that, in the broader perspective, most price action was just short-term gyration which can be exploited with varying degrees of experience.
If you prefer a good night’s sleep, the focus should obviously remain on the dominant trend in the bigger picture. You’ll then have to live with the inevitable volatility.
When doing this analysis with individual stocks, I would perform it with its fundamentals in mind. What growth story is the business pursuing? Are the right people at its helm and delivering executional excellence? Do fundamental metrics back up that story?
For stocks to go up, determinant factors are revenue growth and earnings growth. The Boston Consulting Group further cites profitable, “value-creating” revenue growth as primary driver. Growing ‘at all costs’ is where many businesses fail.
A parabolic curve, after all, is a mere visual reflection of the business’s trajectory. It does not feed on itself.
Conclusion
When coming back to Cicero’s quote, we have to conclude that we cannot look at a parabolic curve independently from its context. We must bring a good understanding of other disciplines to the table in order to be consistently successful.
That’s why I’m convinced that trend following is an occupation for people with a multidisciplinary background who enjoy intellectual debates, challenges and puzzles — not for the simple-minded chasing instant fortunes.
Now that we have the foundational part of trend following cleared, let’s proceed with trading bounces using moving averages.
Matt Hagemann
October 12, 2020