How to Read Price Action to Master Trend Trading
Price action is the trading activity in a pricing process. It is used in trend trading to understand how trends evolve and how they can be traded for profit. Here you’ll learn how to read price action in trend trading.
Price action is what happens when market participants gather to trade their disputes and this excites news pundits and traders alike.
Up until this day, no one knows where the ultimate value or perfect market valuation for a company is, let alone for an entire market. Investors determine their own fair prices, occasionally publish their research, and hope that other market participants will eventually agree with their thesis.
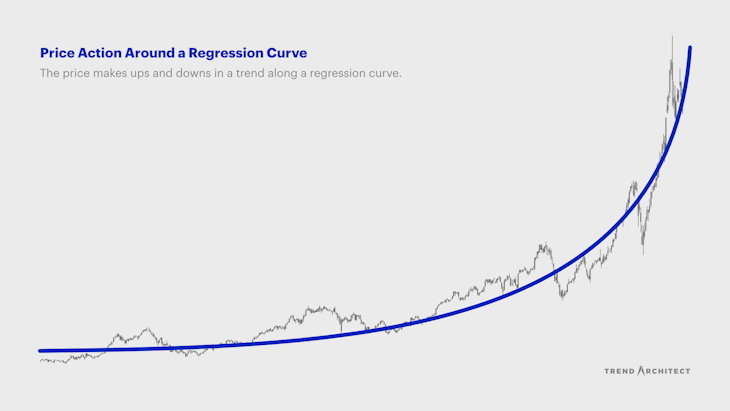
Be aware, however, that price action is simply taking place around an underlying parabolic curve. Parabolic curves in the shape of logarithmic lines can be an indication for where that perfect market valuation may be.
While the price moves up and down, it is doing so in an orderly trend. As a trend trader, your job is to identify that trend and follow it.
Price Action Reflects a Pricing Process
Investors have a desire to make money. So they look around and see what other (potential) investors are thinking and compare their analyses or interpret ad hoc news items in the feed.
Prices move up or down as new information becomes available and is interpreted. Computer algorithms can already price in news items within minutes and crowd intelligence will collectively top it off with another layer of precision. Prices are never constant because they are susceptible to uncertain projections into the future.
It’s all dynamic. Everything changes all the time. Relative valuations change throughout the day, businesses evolve, so do whole economies.
We are all moving in a sphere of tremendous lack of knowledge which must naturally lead to a herding effect. That is why markets get so compulsive by getting way overvalued or undervalued.
This activity of a pricing process is what we call price action. It happens whenever the market is open for trading and the process isn’t necessarily instant. It is a process after all and it can last for an extended period of time, offering plenty of opportunities for arbitrage.
A Battle Between Bulls and Bears
Price action can be observed on a chart. It is the movements happening as the price evolves. A battle reveals itself between two opposing sides consisting of bulls and bears. Each side fights for control and the battle is never in balance, otherwise we wouldn’t witness any movements at all. It would be a standstill.
The bullish group and bearish group have entirely incompatible interests and gather each day to fight for the upper hand.
- Bullish market participants want the price to rise because only then they will make money, but they will forfeit money if the price falls.
- Bearish market participants have the exact opposing interest.
Price action is a visualization of this dynamic fight. You’ll quickly discover something similar to a tug of war where two opposing sides pull on a rope on both ends. Both sides have the aim to drag the competitor over a border line.
Once a party has gained some degree of advantage, it will be very difficult for their opponent to end this influence. It is foreseeable that the losing party’s best efforts are not going to result in victory.
If the price is trending higher, you have bulls in a more advantageous position than bears. Nevertheless, bears counter against this influence at every opportunity of resistance and yield back, then regroup higher from where they attempt a fresh attack to push the bulls back down toward support. It causes bulls to regroup there in larger numbers with the ambition to push prices back up again, and ideally beyond.
This regrouping occurs at areas of support and resistance and explains the frequent setbacks resulting in ranges in a trend.
Price can only go up if more people are willing to buy and they can only go down if more people are willing to sell. The willingness to buy or sell is a result of their respective perception of the future value relative to the current value (the difference being an arbitrage opportunity).
The actual reversal from an uptrend to a downtrend takes place once support is broken and an insufficient number of market participants were willing to subscribe to a bullish story.
Having this picture in mind greatly enhances your decision-making because you will recognize the forces at play. It’s an everlasting way to participate in the stock market because the battle between bullish and bearish investors never ends as long as the market exists.
How to Trade Price Action
The objective in trend trading is to be positioned in the right direction with the dominant trend. I think the real edge comes from recognizing the very early stage of a trend reversal. I’ve always made it a point to position myself as close as possible toward the beginning of a new trend. The earlier you can accurately detect signs of a reversal, the more profit you will yield.
It makes a big difference whether you positioned yourself at the beginning, somewhere in the middle, or towards the end of a trend (when it’s already painfully obvious to everyone).
Imagine a stock that reacted strongly to an earnings announcement. Your response should be assessing it in the context of the underlying parabolic curve and its existing trend patterns.
- What parabolic curve is the price action on? Check the four types of parabolic curves to determine which one applies to the current trend.
- Was there a meaningful deviation from the parabolic curve? The Law of Inertia does not allow prices to jolt all over the place but progress in predictable stages of acceleration or deceleration.
- Was there a meaningful break of a support or resistance level according to the Dow Theory? The theory identifies higher highs (HH) and higher lows (HL) in an uptrend, and lower highs (LH) and lower lows (LL) in a downtrend.
An analysis that answers above questions may look like this (HH indicating a higher high and HL indicating a lower high):
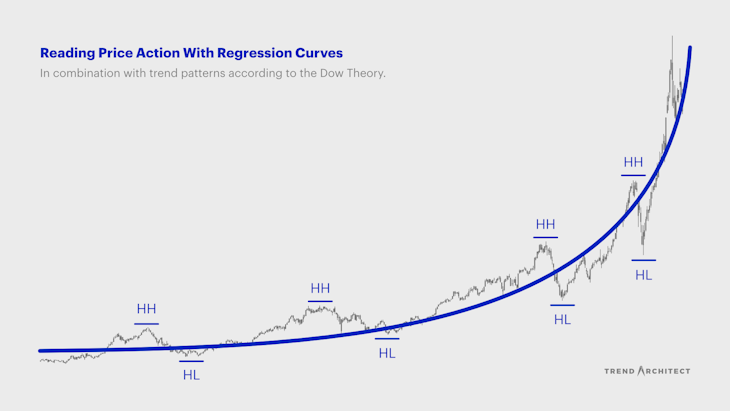
You don’t watch CNBC or find articles on Yahoo Finance to answer these questions. You look at your chart and apply what we have discussed above. News pundits come up with an arbitrary reason on every market movement and dramatize it all the time. We are programmed to look for causation because this is our nature as storytelling animals — but unfortunately this won’t be helping you here.
Not a single spectacular return of mine resulted from studying news items, but from studying price action.
Learn to ignore the hype, ignore the reasons, ignore your own prejudices and learn to understand what price action is telling you. With lots of practice and lots of patience, you will have good judgment to ride the next big trend.
Matt Hagemann
November 2, 2020