Trend Trading With Multiple Timeframes
Increase your profitability using multiple timeframes. You can even find high risk-to-reward trading opportunities with the exponential moving average.
If you analyze price action in a single timeframe, you are limiting your perspective. It’s comparable to walking around unfamiliar territory while wearing blinkers. To trade profitably, you should broaden your perspective with multiple timeframes.
The objective of trading with multiple timeframes is to identify the dominant trend in a larger timeframe and to find an entry in the direction of that dominant trend in a smaller timeframe.
By zooming out, you learn how a stock has performed over its lifetime. Seeing things from the top down is called “higher-level thinking”. Think of it as looking at yourself from outer space. From that vantage point, you can see the relationships between the continents, countries, and seas. Then you can get more granular by zooming down to your country, your city, your neighborhood, and finally, your immediate proximity. The zoom levels represent timeframes in our charts.
Because different market participants are trading with different objectives (holding positions from a few hours right up to holding for many years), our charts need to accommodate that price action is an aggregation of short-term to long-term biases.
The Best Timeframes for Trend Trading
Focus on the bigger picture. A trend in large timeframes has had more time to unfold, which means that a lot more market participants will have to change their bias to reverse direction than in smaller timeframes.
An excerpt from The Book of Five Rings by Miyamoto Musashi articulates this idea well:
The large scale is easy to see; the small scale is hard to see. To be specific, it is impossible to reverse the direction of a large group of people all at once, while the small scale is hard to know because in the case of an individual there is just one will involved and changes can be made quickly.
Traders get the best overview once all relevant timeframes are shown at the same time. Trend followers commonly use the following 4 timeframes:
- Monthly
- Weekly
- Daily
- Hourly
Everything in between is an intermediary of the aforementioned. You may have heard of traders using the 5-minute timeframe, for example, but I think they are amateur thrill-seekers. Traders who do not trade by what others are seeing will soon find themselves in trouble. Trader A can look at the 5-minute timeframe, whereas Trader B prefers the 30-minute. It’s evident that both can come to different conclusions in the very same instant. Whichever patterns shape up there may be completely irrelevant in the bigger picture.
Since we don’t want to be bothered with random chart pattern formations, we should focus on trends in larger timeframes.
Moving Averages in Multiple Timeframes
Pure price action is often not enough to navigate trends for profit. We need a few reference points for navigation. The moving average indicator, specifically the 200-period Exponential Moving Average (or 200 EMA), is one of the most reliable indicators for trend trading. You should therefore add the 200 EMA to your charts.
Imagine yourself wanting to buy Apple. It appeared on my stock screener when it was nearing its weekly 200 EMA in 2013. As mentioned above, we zoom out to the monthly timeframe and ascertain the overall direction of the primary trend.
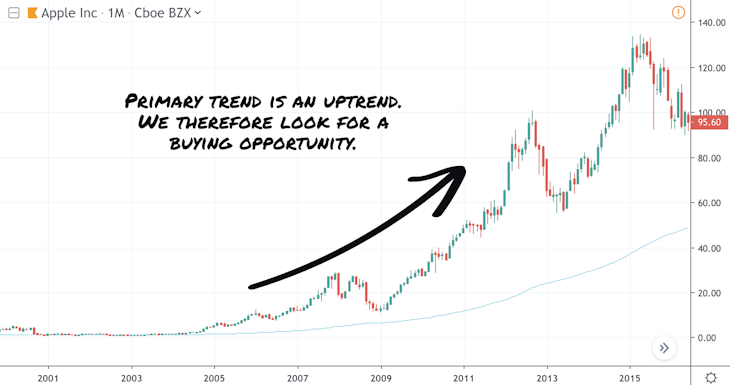
Apple’s shares have clearly been in a strong uptrend and are undergoing short-term weakness in a secondary trend. You do not want to bet against the trend at this stage. If you short a stock that has already weakened for months, you’re not thinking ahead of the crowd.
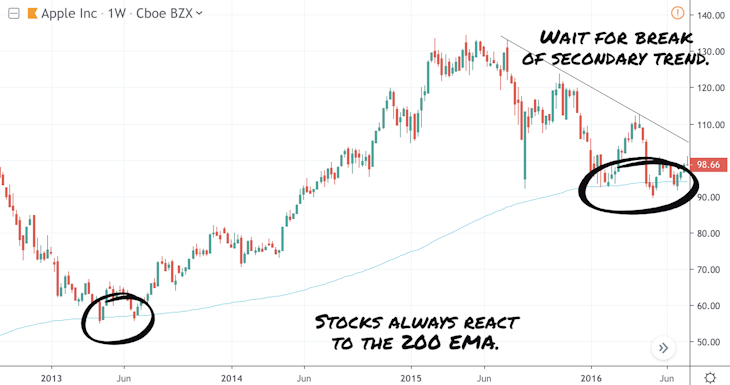
Other than that, the stock price landed on the 200 EMA and is potentially finding support there. The correct approach is to think about how you can exploit this short-term weakness and look for a buying opportunity as soon as the price resumes its primary trend.
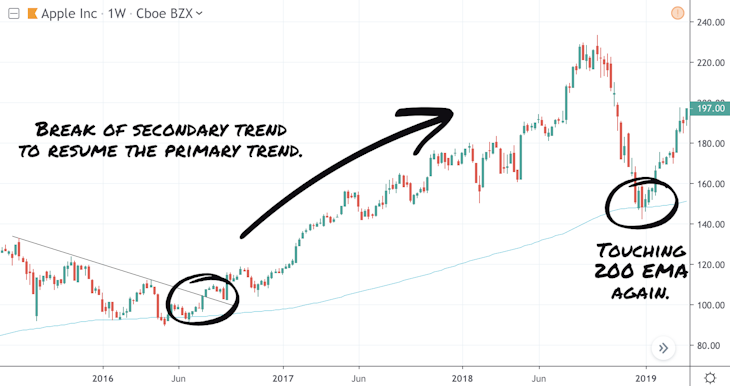
A buying opportunity in a secondary downtrend could emerge once the stock price breaks above that downtrend after it bounced off the 200 EMA. I’ve annotated a downtrend line to help you visualize when a trade entry presented itself:
Newbie traders typically focus on smaller timeframes and ignore the dominant primary trend in larger timeframes. Let’s see what happened after bulls broke the downtrend:
In summary, this is how we used multiple timeframes to analyze a stock:
- We zoom out to the monthly chart to understand where the dominant primary trend is headed.
- After ascertaining that the primary trend is pointing upwards, we zoomed in on the weekly chart to look for a buying opportunity.
- The price found support at its weekly 200 EMA and a visible downtrend line of the secondary trend broke a few weeks later.
- We used the 200 EMA in all timeframes. You’ll be surprised to witness how stocks react once they get close to this EMA.
By watching multiple timeframes at the same time, you greatly increase your odds for a profitable trade. They ultimately show you the underlying trend and offer precise entry opportunities with favorable risk-to-reward ratios.
Matt Hagemann
October 18, 2021